How to Visualize Your Law Firm’s Marketing Data With Looker Studio
Date: August 13, 2024

According to the ABA’s 2023 Websites & Marketing TechReport, “whether working with in-house or external marketers, only approximately 20% of respondents say they receive regular reports of marketing performance.” With so many marketing analytics tools, combining your data into one comprehensive report can often be challenging. That is where Looker Studio comes into play.
What is Looker Studio?
Looker Studio, formerly known as Data Studio, is a free online tool from Google that helps you convert your data into customizable, informative reports and dashboards. Looker Studio allows you to connect multiple data sources into one comprehensive report, making it easy to visualize the data most important to you and your firm.
What Type of Data Sources Can Be Connected With Looker Studio
There are various different data sources you can connect to Looker Studio to satisfy your reporting needs. Some of the most popular data sources available for connecting include:
- Google Analytics (GA4)
- Google Search Console
- Google Business Profile
- Google Ads
- CallRail
To view the full list of data sources visit the Looker Studio website.
How to Create a Report With Looker Studio
Creating reports in Looker Studio is a relatively straightforward process where once you understand the basics you should be able to use the tool to your advantage.
Templated Reporting
Looker Studio provides a handful of templated reports for you to utilize which makes creating certain dashboard reports easier. Some of the templated reports include pre-made dashboards for the following:
- Google Analytics
- BigQuery
- Google Sheets
- YouTube Analytics
- Google Ads
- Search Console
- Display & Video 360
- Search Ads 360
- Apigee
Creating a Templated Report
Now let’s dive into how you can create your templated report. For this example, we’ll set up a template report for GA4.
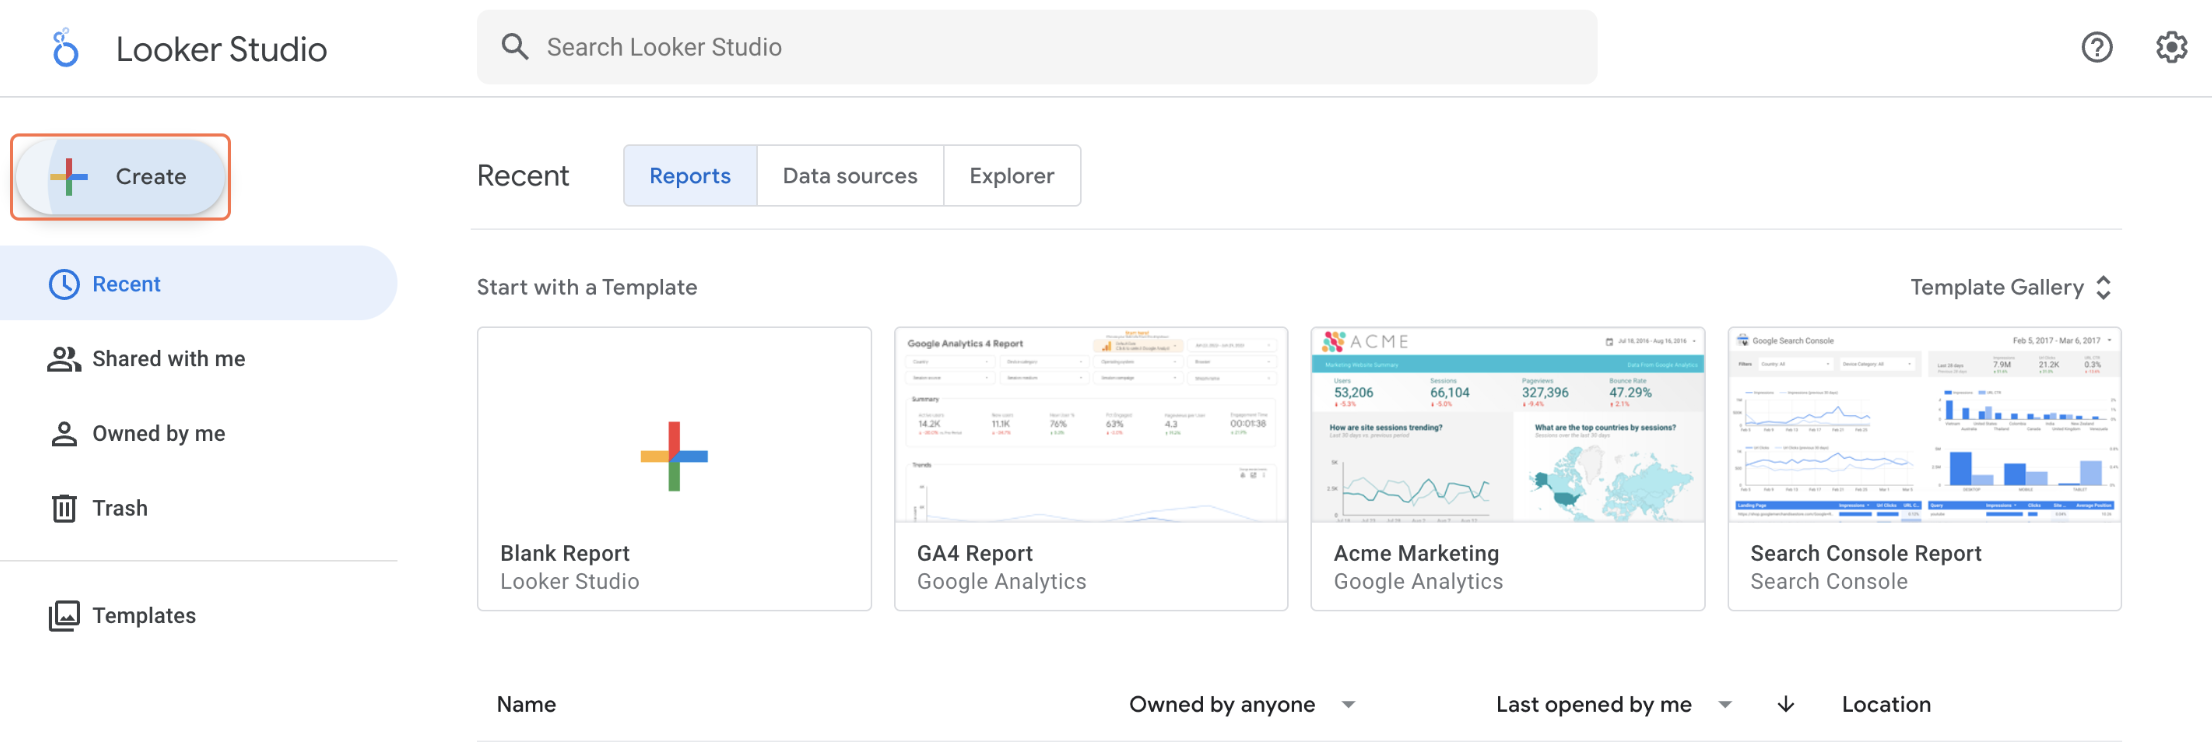
First things first you’ll need to connect your data source. Once in Looker Studio, hit the ‘Create” button in the top left corner.
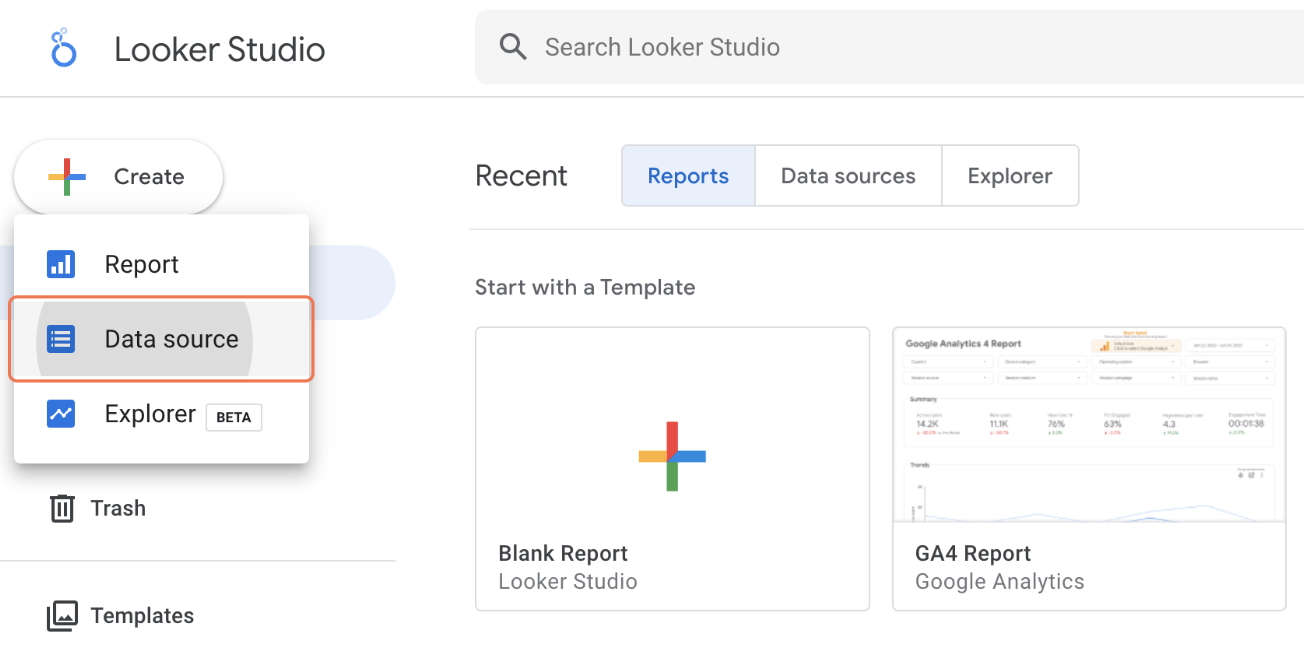
Once you click on ‘Create,’ you’ll be given three options. To connect the data, you’ll want to click ‘Data Source.’
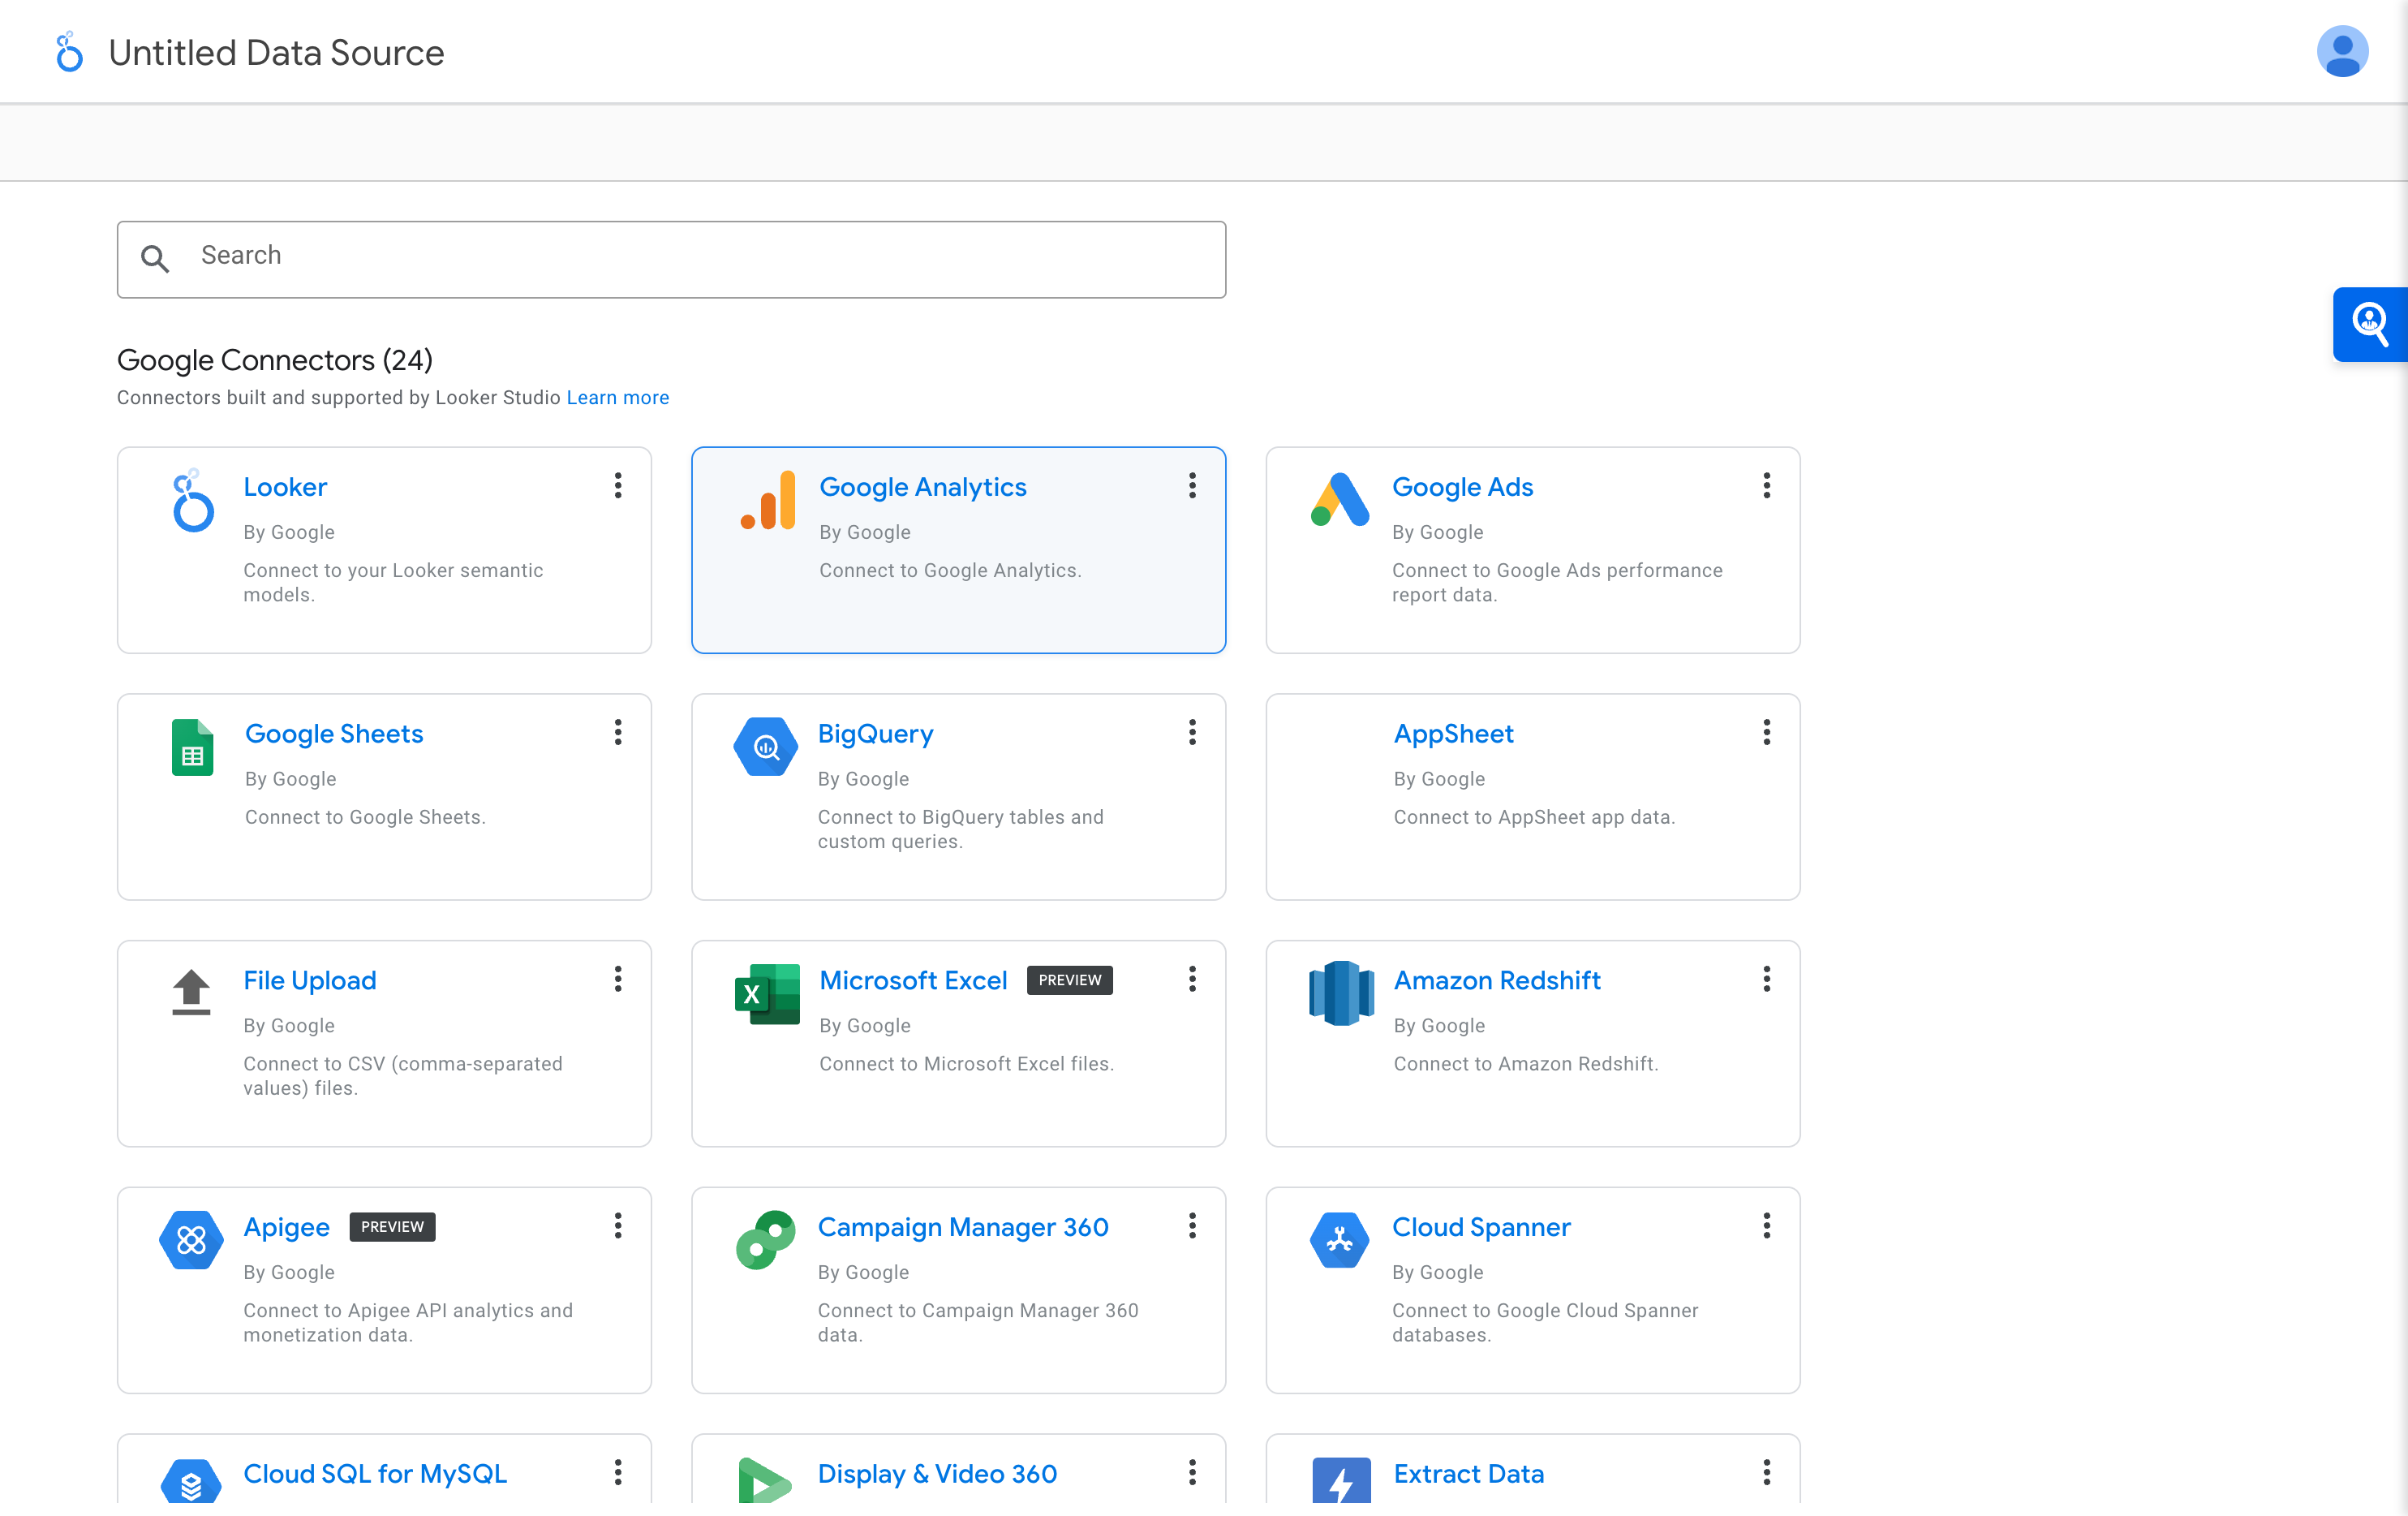
After hitting ‘Data Source,’ you’ll be taken to a screen that shows all of the options. Navigate to Google Analytics and click on that button. Don’t forget to name your Data Source as well. For example, you can name it “GA4 Data Source” or your firm name and then “GA4.”
Once you click on Google Analytics, it will take you to the set up screen where you can finish setting up your data source connection. Once everything is connected properly you will have your templated GA4 report.
Custom Reporting
As mentioned earlier in this article, within Looker Studio you are also able to create custom reports based on your law firm’s needs. Following the same instructions as above, you can add additional data sources as well as create a blank report to customize it as you see fit.
Start Creating Meaningful Reports
Now that you have the basics of how to create a report using Looker Studio, it’s time to put that into action! I encourage you to go into Looker Studio and play around with things and find the best report option for you. Don’t be afraid to create multiple versions of your report to see the various different ways you are able to display the data.
If you run into trouble or need assistance setting up your reporting through Looker Studio, feel free to reach out to the team at 9Sail to see how we can help! Our law firm SEO experts use Looker Studio to create reports for our clients and can help by setting up dashboards or custom reports that are most optimal for your law firm.